References
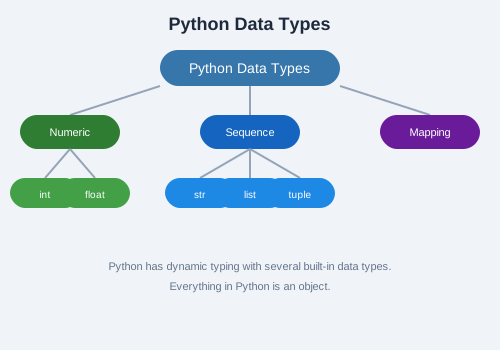
Python Built-in Functions Reference
abs(x)            # Absolute value
all(iterable)     # True if all elements are truthy
any(iterable)     # True if any element is truthy
bin(x)            # Binary string representation
bool(x)           # Convert to boolean
chr(i)            # Unicode character from integer
dict(**kwargs)    # Create dictionary
dir([obj])        # List names in current/local scope
enumerate(iter)   # Returns (index, value) pairs
eval(expr)        # Evaluate string as Python expression
filter(func, it)  # Filter iterable with function
float(x)          # Convert to float
format(val, spec) # Format value with specification
frozenset(it)     # Create immutable set
getattr(obj, name)# Get attribute by name
globals()         # Global symbol table as dict
hasattr(obj, n)   # Check if attribute exists
hash(obj)         # Hash value of object
help([obj])       # Interactive help
hex(x)            # Hex string representation
id(obj)           # Unique identifier
input([prompt])   # Read user input
int(x)            # Convert to integer
isinstance(o, t)  # Type checking
iter(obj)         # Get iterator
len(s)            # Length of sequence
list([iter])      # Create list
locals()          # Local symbol table as dict
map(func, *iter)  # Apply function to iterables
max(iterable)     # Maximum value
min(iterable)     # Minimum value
next(iterator)    # Next item from iterator
oct(x)            # Octal string representation
open(file, mode)  # Open file
ord(c)            # Unicode code point
pow(x, y)         # x**y
print(*obj)       # Print objects
range(start,stop) # Generate integer range
repr(obj)         # String representation for devs
reversed(seq)     # Reverse iterator
round(x, n)       # Round to n decimal places
set([iter])       # Create set
slice(start,stop) # Create slice object
sorted(iter)      # Return sorted list
str(obj)          # String representation
sum(iterable)     # Sum of elements
super()           # Access parent class
tuple([iter])     # Create tuple
type(obj)         # Get type of object
vars([obj])       # __dict__ of object
zip(*iterables)   # Aggregate elements from iterables
NumPy Reference
import numpy as np

# Array creation
np.array([1, 2, 3])
np.zeros((3, 4))
np.ones((2, 3, 4))
np.eye(5)                # Identity matrix
np.arange(start, stop, step)
np.linspace(0, 1, 100)   # 100 evenly spaced points
np.random.rand(3, 3)     # Uniform random
np.random.randn(100)     # Normal distribution

# Array properties
arr.shape, arr.dtype, arr.size, arr.ndim, arr.T

# Reshaping
arr.reshape(2, -1)
arr.ravel()              # Flatten to 1D
np.concatenate([a, b], axis=0)
np.split(arr, 3, axis=0)

# Operations
np.add, np.subtract, np.multiply, np.divide
np.dot(a, b)             # Dot product
np.sum, np.mean, np.std, np.var, np.min, np.max, np.argmin
np.sort(arr, axis=-1)
np.where(condition, x, y)

# Linear algebra
np.linalg.inv, np.linalg.det, np.linalg.eig
np.linalg.svd, np.linalg.qr
Pandas Reference
import pandas as pd

# Series
s = pd.Series([1, 2, 3], index=["a", "b", "c"])
s.values, s.index, s.name

# DataFrame
df = pd.DataFrame(data, index=rows, columns=cols)
df.head(n), df.tail(n), df.info(), df.describe()
df.columns, df.index, df.dtypes, df.shape

# Selection
df["col"]               # Single column
df[["a", "b"]]          # Multiple columns
df.loc["row"]           # Label-based
df.iloc[0]              # Position-based
df[df["age"] > 30]      # Boolean indexing

# Cleaning
df.dropna(), df.fillna(val), df.drop_duplicates()
df.rename(columns={}), df.replace(old, new)

# Grouping and aggregation
df.groupby("col").mean()
df.groupby("col").agg({"salary": "sum", "age": "mean"})
df.pivot_table(values="val", index="row", columns="col")

# Merge and join
pd.merge(df1, df2, on="key", how="inner")
df1.join(df2, how="left")

# Input/output
pd.read_csv, pd.read_excel, pd.read_json, pd.read_sql
df.to_csv, df.to_excel, df.to_json, df.to_sql
Matplotlib Reference
import matplotlib.pyplot as plt

# Plot types
plt.plot(x, y, fmt)          # Line plot
plt.scatter(x, y)            # Scatter plot
plt.bar(x, height)           # Bar chart
plt.barh(y, width)           # Horizontal bar
plt.hist(data, bins)         # Histogram
plt.boxplot(data)            # Box plot
plt.pie(sizes, labels)       # Pie chart
plt.imshow(image)            # Image display
plt.contour(X, Y, Z)         # Contour plot

# Customization
plt.title("Title", fontsize=14)
plt.xlabel("X label"), plt.ylabel("Y label")
plt.xlim(0, 10), plt.ylim(0, 100)
plt.xticks(rotation=45)
plt.grid(True, alpha=0.3)
plt.legend(loc="best")
plt.tight_layout()

# Colors and styles
plt.plot(x, y, color="red", linestyle="--", linewidth=2, marker="o")
plt.style.use("ggplot")

# Subplots
fig, axes = plt.subplots(2, 3, figsize=(10, 6))
axes[0, 0].plot(x, y)
plt.tight_layout()

# Saving
plt.savefig("plot.png", dpi=300, bbox_inches="tight")
plt.show()
SciPy Reference
from scipy import optimize, stats, signal, integrate, linalg

# optimize
optimize.minimize(fun, x0, method="BFGS")
optimize.curve_fit(func, xdata, ydata)
optimize.root(func, x0)
optimize.linear_sum_assignment(cost_matrix)

# stats
stats.norm.pdf(x, loc=0, scale=1)     # PDF
stats.norm.cdf(x)                      # CDF
stats.norm.ppf(q)                      # Percent point function
stats.ttest_ind(group1, group2)        # Independent t-test
stats.ttest_rel(before, after)         # Paired t-test
stats.chisquare(f_obs, f_exp)
stats.pearsonr(x, y)                   # Correlation
stats.describe(data)                   # Summary statistics
stats.zscore(data)                     # Standardize

# signal
signal.convolve(signal, kernel)
signal.correlate(a, v)
signal.spectrogram(x)
signal.savgol_filter(x, window_length, polyorder)

# integrate
integrate.quad(func, a, b)             # 1D integration
integrate.dblquad(func, a, b, gfun, hfun)
integrate.solve_ivp(fun, t_span, y0)   # ODE solver
Note: These reference pages summarize the most commonly used functions. For full documentation, visit docs.python.org, numpy.org/doc, pandas.pydata.org, matplotlib.org, and docs.scipy.org.
Exercise: Use this reference sheet to solve a real problem: load a dataset using Pandas, filter and group it, create two subplot visualizations, run a statistical test using SciPy, and save the results. Refer back to the function signatures above as needed.