Unsupervised Learning in Depth
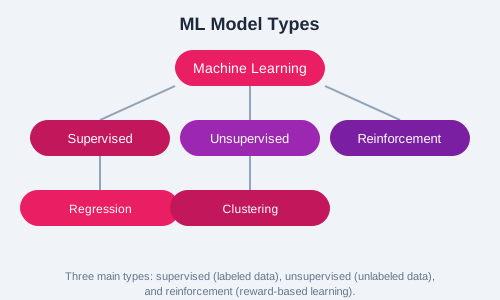
Unsupervised learning discovers hidden patterns in unlabeled data. It is widely used for customer segmentation, anomaly detection, data compression, and exploratory analysis. This chapter covers clustering, dimensionality reduction, and anomaly detection.
Clustering Overview
Clustering groups similar data points together. Points in the same cluster are more similar to each other than to points in other clusters. Clustering is used in market segmentation, image compression, and social network analysis.
K-Means Clustering
K-Means partitions data into k clusters by iteratively assigning points to the nearest centroid and updating centroids. It is fast and scalable but requires you to specify k and is sensitive to initialization.
from sklearn.cluster import KMeans
import matplotlib.pyplot as plt

# Find optimal k using elbow method
inertias = []
for k in range(1, 11):
    kmeans = KMeans(n_clusters=k, random_state=42)
    kmeans.fit(X)
    inertias.append(kmeans.inertia_)

plt.plot(range(1, 11), inertias, marker='o')
plt.xlabel('Number of clusters')
plt.ylabel('Inertia')
plt.show()
DBSCAN
DBSCAN groups points that are closely packed together, marking points in low-density regions as outliers. It does not require specifying the number of clusters and can find arbitrarily shaped clusters.
from sklearn.cluster import DBSCAN

dbscan = DBSCAN(eps=0.5, min_samples=5)
labels = dbscan.fit_predict(X)

# -1 indicates noise/outliers
n_clusters = len(set(labels)) - (1 if -1 in labels else 0)
print(f"Number of clusters: {n_clusters}")
Hierarchical Clustering
Hierarchical clustering builds a tree of clusters (dendrogram). It can be agglomerative (bottom-up) or divisive (top-down). It is useful for visualizing cluster relationships at different granularities.
Dimensionality Reduction with PCA
Principal Component Analysis (PCA) reduces the number of features while preserving as much variance as possible. It is used for visualization, noise reduction, and speeding up other algorithms.
from sklearn.decomposition import PCA
import matplotlib.pyplot as plt

pca = PCA(n_components=2)
X_pca = pca.fit_transform(X)

plt.scatter(X_pca[:, 0], X_pca[:, 1], c=labels, cmap='viridis')
plt.xlabel('First Principal Component')
plt.ylabel('Second Principal Component')
plt.show()

# Explained variance
print(f"Explained variance ratio: {pca.explained_variance_ratio_}")
print(f"Total variance captured: {sum(pca.explained_variance_ratio_):.2f}")
Anomaly Detection Use Cases
Unsupervised learning excels at detecting unusual patterns. Applications include fraud detection (unusual transactions), network intrusion detection, manufacturing defect detection, and monitoring sensor data for equipment failure.
from sklearn.ensemble import IsolationForest

iso_forest = IsolationForest(contamination=0.1, random_state=42)
anomalies = iso_forest.fit_predict(X)

# -1 indicates anomaly
print(f"Anomalies detected: {(anomalies == -1).sum()}")Summary
Unsupervised learning reveals structure in unlabeled data. Master K-Means, DBSCAN, hierarchical clustering, and PCA. These tools are essential for data exploration and preprocessing.